Author

admin

Browsing

Nvidia CEO Jensen Huang sold 100,000 shares of the chipmaker’s stock on Friday and Monday, according to a filing with the U.S. Securities and Exchange Commission.

The sales are worth nearly $15 million at Tuesday’s opening price.

The transactions are the first sale in Huang’s plan to sell as many as 600,000 shares of Nvidia through the end of 2025. It’s a plan that was announced in March, and it’d be worth $873 million at Tuesday’s opening price.

The Nvidia founder still owns more than 800 million Nvidia shares, according to Monday’s SEC filing. Huang has a net worth of about $126 billion, ranking him 12th on the Bloomberg Billionaires Index.

The 62-year-old chief executive sold about $700 million in Nvidia shares last year under a prearranged plan, too.

Nvidia stock is up more than 800% since December 2022 after OpenAI’s ChatGPT was first released to the public. That launch drew attention to Nvidia’s graphics processing units, or GPUs, which were needed to develop and power the artificial intelligence service.

The company’s chips remain in high demand with the majority of the AI chip market, and Nvidia has introduced two subsequent generations of its AI GPU technology.

Nvidia continues to grow. Its stock is up 9% this year, even as the company faces export control issues that could limit foreign markets for its AI chips.

In May, the company reported first-quarter earnings that showed the chipmaker’s revenue growing 69% on an annual basis to $44 billion during the quarter.

This post appeared first on NBC NEWS

Melbourne, Australia (ABN Newswire) – Lithium Universe Limited (ASX:LU7) (FRA:KU00) (OTCMKTS:LUVSF) is pleased to announce that further to its announcement dated 18 June 2025 (Announcement), it has now settled the first tranche of its placement to sophisticated and professional investors (Tranche 1).

Highlights

– Successful settlement of Tranche 1 of the share placement to sophisticated and professional investors, raising $0.60 million

– Tranche 2 of the placement (subject to shareholder approval) is anticipated to be completed on or around 29 July 2025, raising $1.10 million

Tranche 1 comprised of 150,000,000 fully paid ordinary shares in the capital of the Company (Shares), which have been issued today under the Company’s existing capacity under ASX Listing Rule 7.1 (15% capacity). The Shares under Tranche 1 were issued at a price of A$0.004 per Share, raising A$600,000. In addition, subject to shareholder approval, the Tranche 1 investors will be entitled to one new option for every two Shares subscribed for and issued, expiring 36 months from the date of issue of the options, and an exercise price of $0.008 (Options).

Tranche 2 Placement

As detailed within the Announcement, the placement comprises a second tranche of 275,000,000 Shares at an issue price of A$0.004 per Share, subject to shareholder approval (Tranche 2). Investors under the Tranche 2 placement will also receive a free attaching Option on a 1 for 2 basis, subject to shareholder approval.

The Company will seek shareholder approval at an upcoming general meeting, which is scheduled to be held on or around Wednesday, 23 July 2025.

Cleansing for secondary trading

The Company advises that the Shares issued under Tranche 1 have been issued without disclosure under Part 6D.2 of the Act in reliance on sections 708(8) and 708(11) of the Corporations Act 2001 (Cth) (Corporations Act).

In accordance with Section 708A(11) of the Corporations Act 2001, the Company confirms:

– the Shares under Tranche 1 are in a class of securities that are quoted securities;

– the Company lodged a prospectus with the Australian Securities and Investments Commission on 20 June 2025 (Prospectus);

– the Prospectus includes an offer of securities by the Company in the same class as the Shares issued under Tranche 1; and

– the offer under the Prospectus is and was open at the time of issue of the Shares under Tranche 1.

Accordingly, the T1 Placement Shares are eligible for immediate trading without on-sale restrictions.

About Lithium Universe Ltd:  

Lithium Universe Ltd (ASX:LU7) (FRA:KU00) (OTCMKTS:LUVSF), headed by industry trail blazer, Iggy Tan, and the Lithium Universe team has a proven track record of fast-tracking lithium projects, demonstrated by the successful development of the Mt Cattlin spodumene project for Galaxy Resources Limited.

Instead of exploring for the sake of exploration, Lithium Universe’s mission is to quickly obtain a resource and construct a spodumene-producing mine in Quebec, Canada. Unlike many other Lithium exploration companies, Lithium Universe possesses the essential expertise and skills to develop and construct profitable projects.

Source:
Lithium Universe Ltd

Contact:
Iggy Tan
Executive Chairman
Lithium Universe Limited
Email: info@lithiumuniverse.com

News Provided by ABN Newswire via QuoteMedia

This post appeared first on investingnews.com

One of the sharpest copper supply crunches in recent memory is rattling global commodities markets, as inventories at the London Metal Exchange (LME) plummet and the spot price soars.

Bloomberg reported that as of Monday (June 23), copper for immediate delivery was trading at a premium of US$345 per metric ton over three month futures, the widest spread since a record squeeze in 2021.

That dramatic price divergence reflects the market’s acute concerns over access to physical copper, with readily available inventories on the LME falling by around 80 percent this year alone.

Available stockpiles now cover less than a single day of global demand, amplifying anxiety across the supply chain.

Historic backwardation signals market distress

Backwardation in metals markets typically suggests that buyers are scrambling to obtain physical supply. In copper’s case, a combination of logistical, geopolitical and structural forces is driving the surge.

LME stockpiles have been rapidly drawn down as traders and manufacturers shift metal to the US in anticipation of potential trade barriers, spurred by US President Donald Trump’s tariff moves.

That migration has created acute shortages in Europe and Asia. Chinese smelters, responding to the price premium and slackening domestic demand, have begun exporting surplus copper to global markets. Yet those flows have not kept pace with the drawdowns, and China’s own inventories have also dwindled.

The LME had hoped recent regulatory interventions would prevent another disorderly squeeze like the one that disrupted the nickel market in 2022. Last week, the exchange enacted new rules mandating that traders with large front-month positions offer to lend those holdings if they exceed available inventories.

The so-called “front-month lending rule” is meant to discourage hoarding and promote liquidity.

However, recent copper trading data suggest that no single trader is behind the current squeeze. On Monday, the Tom/next spread — a one day lending rate — spiked to US$69 per metric ton.

This would only occur if no one entity held enough copper to trigger lending obligations under the new rules, indicating the tightness is likely the result of broad-based market dynamics rather than manipulation.

LME tightens oversight

As mentioned, the LME has begun cracking down on oversized positions across its metals complex.

In a June 20 statement, the exchange introduced a temporary, market-wide rule to manage large front-month exposures. Under the updated rules, traders holding positions in the front-month contract for a metal that exceed the total available exchange inventories — excluding any stock they already own — must offer to lend those positions at “level,” meaning they are required to roll them over to the next month at the same price.

The rule aims to rein in aggressive moves by commodities trading houses that have made deep inroads into metals markets over the past year. The LME emphasized in its release that recent market interventions are targeted, adding that the newly introduced rule offers a standardized approach.

Still, the unprecedented depth of copper’s backwardation — now extending years into the future — suggests that broader supply/demand dynamics are at play, beyond what position limits alone can control.

For manufacturers and industrial users, the squeeze presents a serious cost and planning risk. Many rely on the LME as a pricing and hedging mechanism. But when exchange inventories drop this low, even large players can face trouble sourcing metal to meet contract obligations. With exchange-based supply nearly exhausted, companies may increasingly turn to off-market deals or bilateral supply agreements — often at higher prices.

This shift weakens the LME’s role as a central clearinghouse for global copper, and raises questions about its ability to handle future shocks, especially as energy transition policies boost long-term demand for the metal.

Market watchers will also be looking to the next moves from Chinese exporters, US trade policy under Trump and the LME’s enforcement of its new regulations.

Securities Disclosure: I, Giann Liguid, hold no direct investment interest in any company mentioned in this article.

This post appeared first on investingnews.com

Cobalt prices are surging after the Democratic Republic of Congo (DRC), the world’s largest producer, extended its export ban by three months in a bid to address global oversupply and stabilize plunging prices.

According to the Financial Times, cobalt prices on China’s Wuxi Stainless Steel Exchange rose nearly 10 percent after the DRC government announced the news over the weekend.

The ban — originally set to expire on Monday (June 23) — will now remain in effect until at least September.

The DRC’s Strategic Mineral Substances Market Regulation and Control Authority (ARECOMS) said the extension was necessary “due to the continued high level of stock on the market.”

The ban, first imposed in February of this year, was initially slated to last four months.

It came after a prolonged slump in cobalt prices, which have plummeted approximately 60 percent over the past three years, reaching a nine year low of US$10 per pound earlier this year.

The DRC produced 72 percent of the global cobalt mine supply in 2024, as per market intelligence firm Project Blue.

The export halt has already begun to ripple through international markets. In China, where most of the world’s cobalt is refined, prices for the metal and related company stocks spiked.

‘We are likely to see an initial price spike, but real pressure will be later in the year as intermediate stocks begin to dry up,’ Thomas Matthews, a battery materials analyst at CRU Group, told Bloomberg. ‘In short, strap yourselves in.’

The government of the DRC is attempting to tackle a persistent supply glut that has undermined the cobalt market since 2022. By curbing exports, Kinshasa is aiming to drive up prices, thereby increasing revenues from royalties and taxes on mining companies, while also incentivizing further investment in its domestic mining infrastructure.

ARECOMS said that a follow-up decision will be made before the new deadline in September, signaling that the ban could be modified, extended or lifted depending on market developments.

Reuters reported last week that Congolese officials are also exploring a quota-based system for cobalt exports, which would allow selected volumes to leave the country while still exerting downward pressure on global supply.

The proposal has garnered support from major industry players.

Glencore (LSE:GLEN,OTC Pink:GLCNF), the world’s second largest cobalt producer and a key stakeholder in Congolese mining operations, is backing the potential quota system. The Swiss trader declared force majeure on some of its cobalt supply contracts earlier this year due to the export restrictions, citing exceptional circumstances. Nevertheless, Glencore has managed to fulfill its obligations so far, thanks to pre-existing cobalt stockpiles located outside the DRC.

By contrast, CMOC Group (OTC Pink:CMCLF,HKEX:3993,SHA:603993), the China-based firm that overtook Glencore as the world’s top cobalt producer in 2024, has been lobbying for the ban’s complete removal.

CMOC, which processes a significant share of Congolese cobalt in China, argues that prolonged supply constraints could jeopardize downstream industries and global battery production.

A race against the clock

Despite initial cushioning from global stockpiles, experts warn that refined cobalt supply may soon run thin.

Transporting cobalt from the landlocked DRC to China’s processing hubs typically takes about 90 days. This means that if shipments do not recommence soon, shortages could begin to materialize in late Q3 or early Q4.

‘Stockpiles of cobalt outside the DR Congo will reach very low levels by the September 21 deadline if nothing else changes,’ Jack Bedder, founder of Project Blue, told the Financial Times.

Cobalt plays a vital role in lithium-ion batteries used in electric vehicles, consumer electronics and renewable energy storage. While many battery makers have begun shifting toward lower-cobalt or cobalt-free chemistries, demand for the metal remains strong — especially for high-performance applications.

Complicating the supply/demand dynamics is the fact that cobalt is often a by-product of copper mining.

With copper prices rebounding sharply — trading around US$9,600 per metric ton this week on the London Metal Exchange — producers have little incentive to curb overall output.

The move to extend the cobalt ban also coincides with the DRC’s recent efforts to assert greater control over its vast mineral wealth. The Central African nation is currently in discussions with the US over a potential minerals partnership aimed at strengthening supply chain security for clean energy technologies.

The export suspension is just the latest in a series of efforts by resource-rich countries to assert more control over key commodities. Similar moves have been seen in Indonesia, which banned nickel ore exports in 2020 to spur domestic processing, and in Chile, where the government is pushing for greater state participation in the lithium sector.

Securities Disclosure: I, Giann Liguid, hold no direct investment interest in any company mentioned in this article.

This post appeared first on investingnews.com

The stock market has been on quite the rollercoaster of late, thanks to news headlines. But investors seem to have shrugged off the past weekend’s geopolitical tensions, at least for now. 

On Tuesday, we saw a surge of enthusiasm. Investors were diving back into stocks and selling off their oil and precious metals holdings. Last week, oil prices spiked amid Middle East tensions, but have now fallen to pre-conflict levels. After what felt like a few weeks of the market moving sideways, maybe the stock market got the catalyst it needed to push the major indexes out of their trading range. A ceasefire between Israel and Iran was enough to get things going.

Stocks Get a Boost

Tuesday’s positive tone helped move the stock market higher, with the S&P 500 ($SPX) closing up 1.1%, finally breaking above the top of its trading range. The Nasdaq Composite ($COMPQ) followed suit, with both indexes within spitting distance of their all-time highs. The Nasdaq 100 ($NDX), which closed 1.53% higher, hit a new all-time high. And let’s not forget the Dow Industrials ($INDU), which is also making a strong attempt to push through key resistance levels, even though it’s a little bit further from its all-time high.

Given the Nasdaq 100’s strong performance on Tuesday, it’s worth taking a closer look at the daily chart of the Invesco QQQ Trust (QQQ).

FIGURE 1. DAILY CHART OF QQQ. The ETF hit a new high on June 24 with a potential Golden Cross. If the relative strength index and percentage price oscillator confirm upside momentum, QQQ could rise higher.Chart source: StockCharts.com. For educational purposes.

Besides hitting a new high, note that the 50-day simple moving average (SMA) crossed above the 200-day SMA. This is referred to as a Golden Cross and can be an early sign of bullishness. While it’s not a guaranteed “green light” at such an early stage, it’s worth watching to see if the 50-day SMA continues to stay above the 200-day SMA.

The relative strength index (RSI) is getting closer to overbought territory. If it crosses above 70, it would be another sign of strong bullish momentum. Similarly, the percentage price oscillator (PPO) needs to move into positive territory, meaning the shorter moving average should cross above the longer one. They’re close, but remember these are lagging indicators, meaning they’ll confirm trends that are already underway. Thus, if the 50-day SMA remains above the 20-day SMA, RSI crosses above 70, and PPO confirms upside momentum, it would confirm further upside move in QQQ.

Another interesting point to note: The Cboe Volatility Index ($VIX) closed at 17.48, which suggests investors are relatively complacent. The VIX was relatively subdued during the Middle East conflict, hitting a high of around 22. With less fear, the charts of the major indexes look like they’re going to hit fresh highs. On Tuesday, Technology, Financials, and Communication Services were the top-performing sectors.

Tech Regains Lead

The Technology sector was powered by semiconductors, which have been driving the market lately. The VanEck Vectors Semiconductor ETF (SMH) has broken above the range it’s been trading within for the last couple of weeks and is now close to its 52-week high (see daily chart of SMH below).

FIGURE 2. DAILY CHART OF SMH. Semiconductors have been driving the stock market lately and broke out above the range from the last couple of weeks.Chart source: StockCharts.com. For educational purposes.

Looking at individual stocks, NVIDIA Corp. (NVDA) was the most actively traded S&P 500 stock. A handful of big names are hitting new all-time highs, too; this includes Broadcom, Inc. (AVGO), Cisco Systems, Inc. (CSCO), International Business Machines (IBM), JP Morgan Chase (JPM), Microsoft Corp. (MSFT), and Netflix Inc. (NFLX), just to name a few. For the complete list, check out the “New Highs” panel in your StockCharts Dashboard; you’ll likely notice a significant percentage of tech stocks on the list.

The positive price action on Tuesday suggests investors are rotating into growth stocks, which signals further upside moves in the S&P 500 and Nasdaq stocks. Here’s a more encouraging sign: even the S&P 500 Equal-Weighted Index ($SPXEW) is breaking out and moving towards its highs. This indicates that the market’s strength isn’t limited to a few big, heavily-weighted growth stocks; participation is much broader.

Travel Stocks Get a Lift

Beyond tech stocks, consumer discretionary stocks also traded higher. The top three performers in the Consumer Discretionary sector were Carnival Corp. (CCL), Norwegian Cruise Lines Holdings (NCLH), and Caesars Entertainment (CZR). The MarketCarpet for the Consumer Discretionary sector below shows travel stocks were strong performers on Tuesday.

FIGURE 3. MARKETCARPET FOR THE CONSUMER DISCRETIONARY SECTOR. The table on the right shows CCL, NCLH, and CZR were the top performers.Image source: StockCharts.com. For educational purposes.

CCL’s stock price gapped up after the company reported strong earnings and guidance. An increase in cruise line bookings indicates consumer sentiment is strong. As a result, cruise lines and travel stocks traded higher. This goes against June’s Consumer Confidence report, which showed weakening confidence. It didn’t seem to impact the market, but it may come back to bite us depending on what news headlines we are likely to receive on Wednesday.

Closing Position

Tuesday’s price action suggests that equities are back on their bullish track after a period of consolidation. Will the upside move hold, or will a negative news headline bring the bears back into the market?

This is where your StockCharts tools come in handy! Keep a close eye on the performance of the major indexes and other helpful indicators such as the RSI and PPO. By using these tools, you can stay on top of the stock market and make investment decisions with greater confidence.


Disclaimer: This blog is for educational purposes only and should not be construed as financial advice. The ideas and strategies should never be used without first assessing your own personal and financial situation, or without consulting a financial professional.

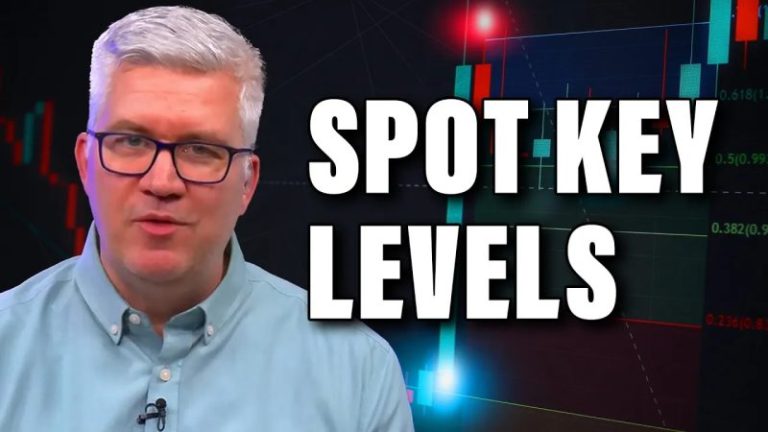
Join Dave as he shares how he uses the power of Fibonacci retracements to anticipate potential turning points. He takes viewers through the process of determining what price levels to use to set up a Fibonacci framework, and, from there, explains what Fibonacci retracements are telling him about the charts of NCLH, RTX, and the S&P 500

This video originally premiered on June 24, 2025. Watch on StockCharts’ dedicated David Keller page!

Previously recorded videos from Dave are available at this link.

As the cycle of uncertainty continues to yield confusion than clarity, investors are again caught having to decide between taking an offensive and defensive posture in the market. The tough part in today’s market environment is how fast situations can shift. With headlines driving the action, sentiment can flip on a dime. So how do you position yourself when breaking news drives the market?

No one can predict how the stock market will play out in the coming months. But keeping an eye on the ratio of “offense” to “defense” stocks can offer some clues. This may not give you a decisive trade scenario, but it can provide a clearer context that can help you form a more bullish or bearish decisive bias.

For this article, let’s refer to the StockCharts Market Summary tool and zoom in on the Technology vs. Utilities ratio (XLK:XLU), which you can find in the Key Ratios – Offense vs Defense panel.

Why XLK:XLU Ratio Matters

This ratio compares the Technology Select Sector SPDR Fund (XLK) with the Utilities Select Sector SPDR Fund (XLU), both being sector proxies (see the one-year ratio chart below).

FIGURE 1. TECH VS UTILITIES RATIO: From a one-year perspective, utilities have outperformed tech.

The key question is whether capital will continue chasing innovation and growth or seek shelter in the relative stability of power grids and water systems. The answer, when it eventually comes, could signal the economy’s next move.

On the one-year chart, the XLK:XLU ratio shows an attempted recovery from a general decline. Note how the ratio percentage is negative. That’s because, over the past year, utilities have generally performed stronger than tech. But we’re seeing tech’s performance strengthening, and a sustained move toward (and eventually into) positive territory would suggest a stronger shift in bullish sentiment.

Notably, XLK and XLU are trading at their respective highs, with XLK already breaking above it. The question remains which sector may be topping or outpacing the other in a more sustained manner.

XLK Breaks Higher: A Bullish Signal?

Here’s a daily chart of XLK.

FIGURE 2. DAILY CHART OF XLK. A proxy for the tech sector, XLK has broken above resistance. The key question now is whether it can hold above this level and follow through, or if it’s topping out amid the current geopolitical uncertainties.

XLK’s surge from its April bottom, including the gap above $243, signals bullish momentum. It’s also trading above the 200-day simple moving average (SMA) while its StockCharts Technical Rank (SCTR) score has climbed above 76, signaling technical strength. Volume-wise, the Chaikin Money Flow (CMF) shows renewed strength in buying pressure, though CMF levels are down considerably since their highest levels in May.

XLU’s Rally: Strong, But Losing Steam

Compare XLK’s chart to XLU’s daily chart.

FIGURE 3. DAILY CHART OF XLU. The Utilities sector is challenging its highs, but is XLU losing steam, and will XLK eventually outpace it?

XLU is attempting to challenge its highs near the $82.50 range, though it hasn’t penetrated the top. Its SCTR score is also bullish at 77, though it’s not as convincing as that of XLK. XLU’s CMF reading also shows weakened buying pressure, as its levels are barely hovering above the zero line.

What These Charts Are Saying

Taken together, these charts aren’t about calling the next big trade. They’re about reading near-term sentiment and getting a feel for where investors think the economy is headed amid this tense geopolitical backdrop.

When both offense and defense are rising, it suggests uncertainty, with capital flowing in both directions. But when one sector pulls ahead, it may signal where institutional money is placing its bets. Whether you’re a short-term trader or long-term investor, tracking this ratio can help anchor your outlook, especially as global events continue to fuel market volatility.

Keep XLK and XLU on your ChartLists and continue to monitor this ratio, along with other comparative tools on the Market Summary page. Also, pay close attention to news developments.

At the Close

The XLK:XLU ratio might not give you the most comprehensive or surefire signal about investor sentiment, but it’s an important piece of the puzzle. It can help you see the bigger picture, which is a crucial step before placing any trades.


Disclaimer: This blog is for educational purposes only and should not be construed as financial advice. The ideas and strategies should never be used without first assessing your own personal and financial situation, or without consulting a financial professional.

A young Brazilian hiker who fell hundreds of meters from the ridge of a towering Indonesian volcano and was trapped there for almost four days was found dead on Tuesday, Brazil’s government said. For days, millions of people in Brazil had watched, posted and prayed as rescuers tried to locate her.

The tourist, 26-year-old Juliana Marins, began summiting on June 21 Mount Rinjani, an active 3,726-meter (12,224-foot) volcano on the Indonesian island of Lombok, with a guide and five other foreigners when she fell some 600 meters (1,968 feet), Indonesian authorities said.

“No signs of life were found,” said Mohammad Syafii, head of Indonesia’s National Search and Rescue Agency.

Marins’ family in Brazil confirmed her death.

The Indonesian rescue team said it found Marins’ body beside a crater using a thermal drone after four days of intensive searches complicated by extremely harsh terrain and weather.

The difficult conditions and limited visibility delayed the evacuation process, Syafii said, as the rescue team climbed carrying Marins’ body to Sembalun basecamp but would have to wait until Wednesday for transport to a police hospital.

Brazil’s Foreign Ministry called her death a tragedy and said that the country’s embassy in Jakarta, the capital of Indonesia, had coordinated the rescue with local authorities.

Marins’ ordeal has riveted her home country, Brazil, with millions following the dramatic search-and-rescue efforts since news broke of her fall.

Authorities did not say when exactly she died.

Adding to the frenzy in Brazil over her ordeal, Brazil’s embassy in Jakarta had accused the Indonesian government of fabricating Marins’ rescue and misinforming her family that she had been located and given food and water just hours after her fall.

There was no immediate response from the Indonesian government on that claim.

Indonesia’s island of Lombok lies east of Jakarta and neighbors the island of Bali. Mount Rinjani, the country’s second-tallest peak, is a popular destination for trekkers.

In an Instagram post, Marins’ family thanked the many Brazilians who had prayed for their daughter’s safety.

Marins, a dancer who lived in Niteroi, outside Rio de Janeiro, had been traveling across Asia since February, her family said. She had visited the Philippines, Vietnam and Thailand before reaching Indonesia.

This post appeared first on cnn.com

A Venezuelan influencer who criticized both gangs and allegedly corrupt cops was shot and killed on Monday while livestreaming on TikTok, authorities said.

Venezuela’s Ministry of Public Safety said in a statement on Instagram that influencer Gabriel Jesús Sarmiento died in the city of Maracay.

Sarmiento often criticized criminal groups and alleged corruption in law enforcement through his content online, and the ministry added that his death came shortly after he reported “threats made against him by members of the GEDOs (Organized Crime Structured Groups, in Spanish) and alleged police officials.”

Maracay is the capital of Aragua, the region from which the notorious Tren de Aragua gang takes its name, though there is no known connection between the TikToker’s death and the criminal group.

The ministry also said it assigned the 69th Prosecutor’s Office Against Organized Crime to “investigate, identify, and prosecute” those responsible for Sarmiento’s death.

“What happened, what happened?” shouts the man in the recording, followed by a heavy burst of gunfire.

“They shot me!” the man then screams. The video ends with the image of two unidentified armed men. Seconds later, the livestream stops and the video ends.

Sarmiento’s death comes just over a month after another Latin American influencer was killed while livestreaming. Mexican beauty influencer Valeria Marquez was shot and killed in a salon in Jalisco in May, sparking outrage over high rates of femicide in the region.

Just days before Marquez’s death, another woman – a mayoral candidate in the state of Veracruz – was shot dead, also during a livestream, alongside three other people.

This post appeared first on cnn.com